The right side of the screen displays your output choices. For Excel, you can create a standard table, a pivot table, or just put the data in a list (Excel Query). You can add a new worksheet or replace an existing worksheet.
For summary queries, you can also select a field to be spread across on the results (as opposed to rows down that apply for the normal field selection). Of course you can do this with an Excel Pivot table, but the formatting by FinJinni can be more flexible.
Check the “Field:” option to enable the drop-downs:
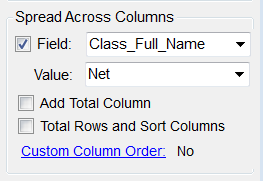
You can use most available fields from the query. The “Value:” selection is of the sum columns defined for the selected template, normally:
Credit, Debit – Self explanatory
Net, Balance – Positive value for income or asset accounts and negative value for expense, liability. This allows summing directly on the Excel table. Net is generally the most useful value.
Amount, – Always positive.
Income
The option “Add Total Column” will add an additional column to the right with the totals of all the spread columns.
The option “Total Rows and Sort Columns” will add row totals at the bottom and sort the spread columns by total value in descending order (i.e. the maximum will appear on the left and the minimum on the right).
Click on the link “Custom Column Order” to enter a custom order for the columns. You must be certain to enter correct column names or the query will fail (it helps to run the query once without this to get the proper names).
Tip: If you want to display time periods across, use one of the queries named with the word “Trend”, which gives you the choices available for time periods in the drop-down.