Better Excel Reporting for QuickBooks Users
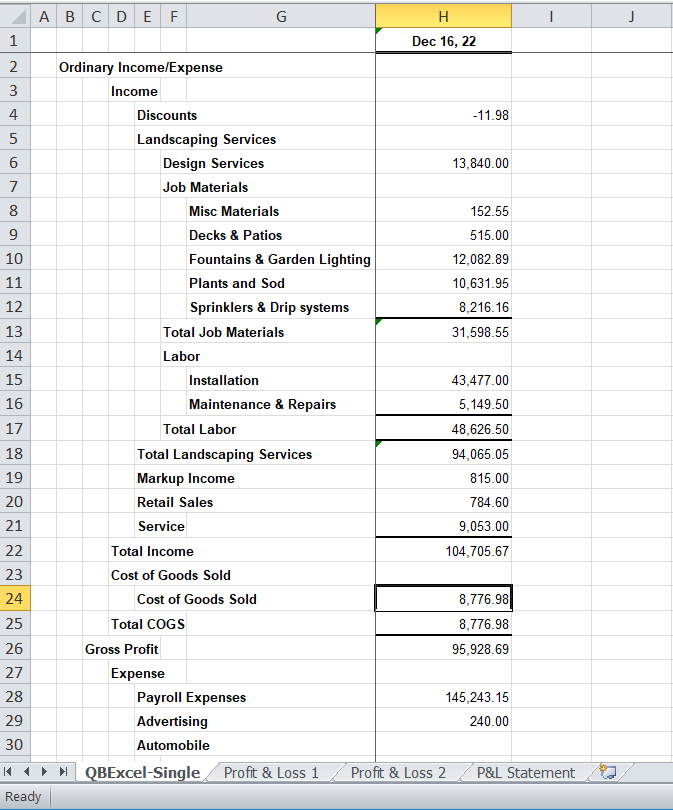
Anyone who has used QuickBooks for some time eventually needs a report in Excel. So you use the convenient Export button and end up with a worksheet like...
All my numbers, nicely totaled and I have to scroll up and down forever. This is a simple company too. If I need to build a different report for analysis, I have a huge cut and paste job ahead of me.
In this particular exercise, I want to create a comparative P&L to compare the performance of 3 companies. Luckily I have QuickBooks Enterprise, which has a feature "Combine Reports from Multiple Companies". After 20 minutes of trying, I gave up, unsuccessful. Plus, it only has a few available reports. I guess I'm going to spend the afternoon cutting and pasting.
Except-> FinJinni to the rescue!
I built a data warehouse with all 3 companies. Now I can do reporting from Excel without even having a company file open (great for switching companies). And comparatives! I can compare companies, years, customers, products, just about any data element.
But let's get back to my 3 companies.

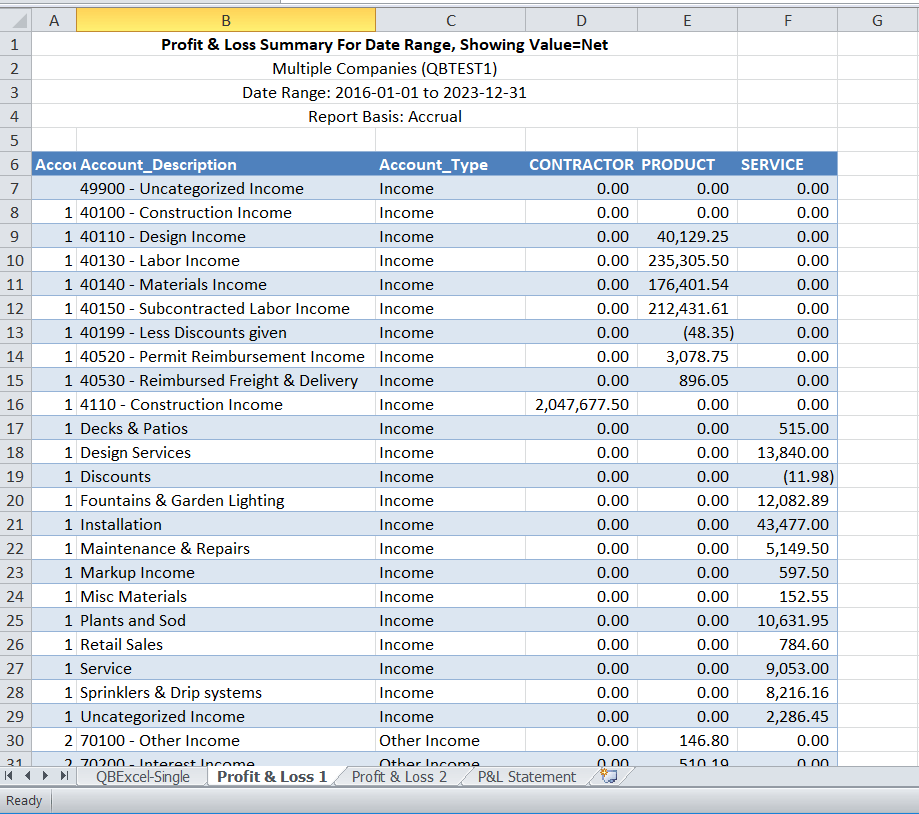
Attempt #1: I displayed the 3 companies across. Result is a table. Took all of a few seconds to produce. But I still have to scroll. By the way, there are a number of products that will take QuickBooks data and put it into tables or pivot tables - not so many that do comparatives, but you can find them if you look.

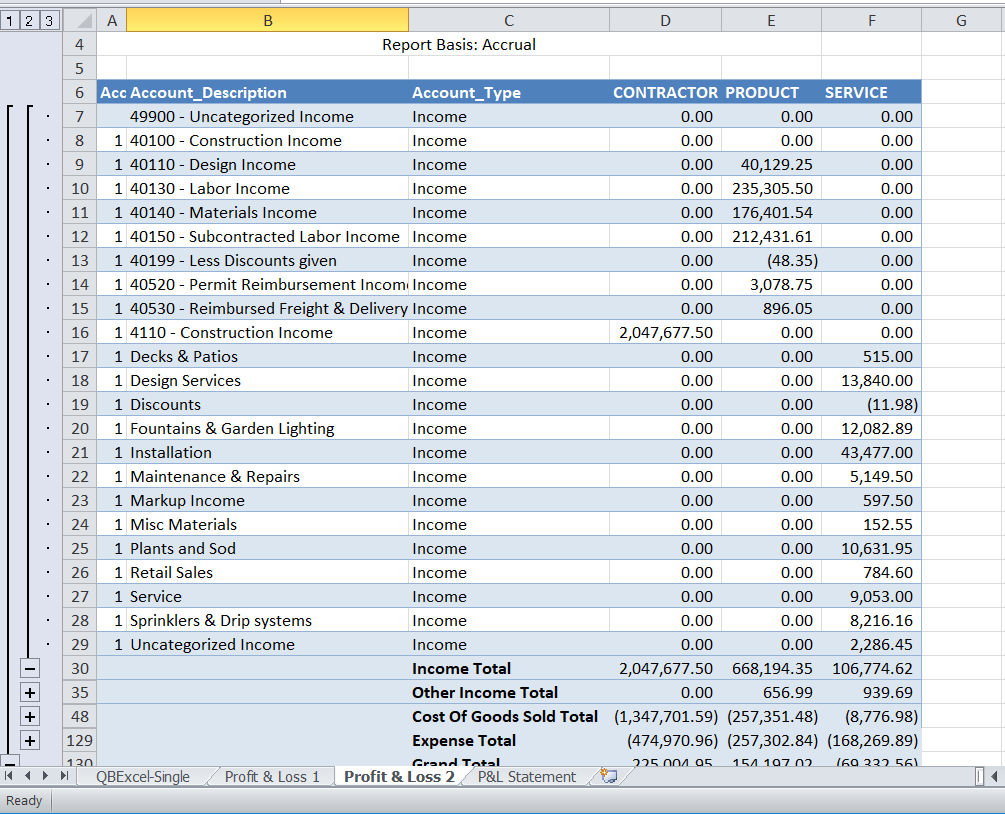
Attempt #2: FinJinni's subtotal option. I subtotaled by account type and now have groups to expand and contract. Again, just a few clicks of my mouse.

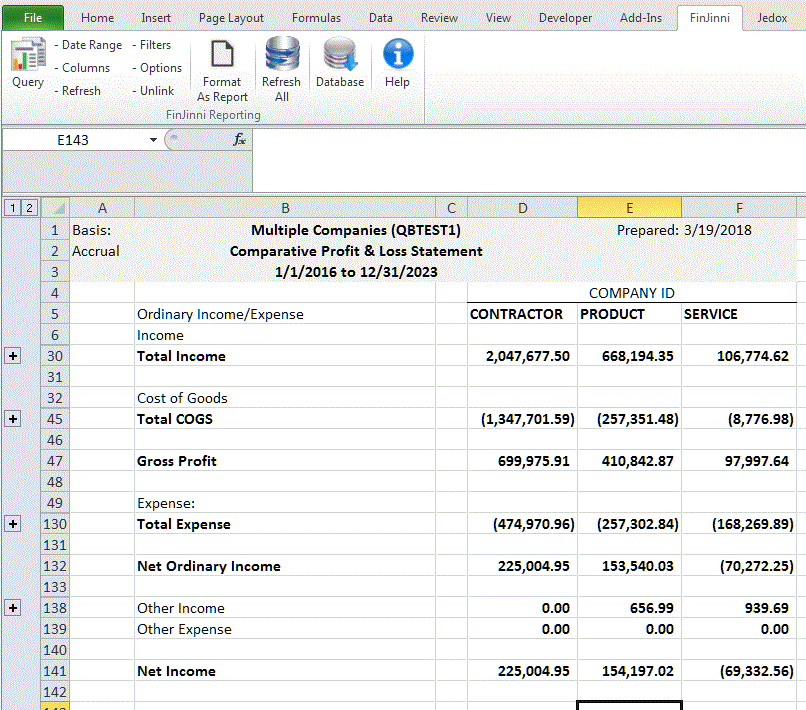
Attempt #3: I really want a nicer report to distribute. FinJinni to the rescue again! With a single button, "Format as Report", FinJinni will take my P&L table and format it as a statement with proper subtotals, groups and column headings for my 3 companies.
Thanks FinJinni!
